-1.png)
User-friendly statistical software to understand your data
Analyze your data with our top-rated statistical modeling tools and intuitive visualizations. Uncover trends and predictions, reveal outliers, and identify critical variables to drive business decisions with confidence.
With Minitab, you can leverage tools such as:
- Statistical Modeling: including Regression Analysis, ANOVA, DOE (Design of Experiments), General Linear Models
- Graphical Analysis: including Histograms, Bar Charts, Scatterplots, Pareto Charts
- Descriptive Statistics: including Hypothesis Testing, Normality Tests, Correlation, Covariance
- Quality Statistics: including Measurement System Analysis, Capability Analysis, Control Charts and Sampling
Discover why 90% of Fortune 100 companies choose Minitab Statistical Software to make better business decisions:
Ease of Use
"What I really appreciate about its usability is that you don’t have to be an expert in stats to be able to use it and to be able to get value from it."
Quality Manager, Manufacturing Organization
Visualizartion
"Minitab made information clear through the statistical output that you get and all of the graphical output that you can do."
Six Sigma Master Black Belt, Top Automotive Company
Training
"I owe a lot of credit to where I’m at today from Minitab's training. Its capabilities ignited the passion in me to apply statistics to manufacturing."
Quality Manager, Medical Device Organization
Support
"There’s actually people on the other end of the phone that can help you get there. That’s awesome."
Continuous Improvement Manager, Manufacturing
Organization
What Makes Minitab the Easiest Statistical Software to Use?

Instant Graph Builder

Step-by-Step Guidance
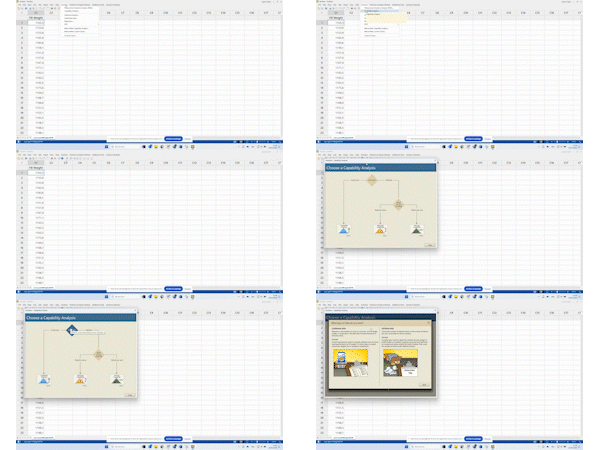
Minitab’s Assistant guides you to choose the right analysis and interpret your results.

24/7 Expert Online Support
Take advantage of our technical support and the Minitab Education Hub for help.


