%20Logo.png?width=100&height=100&name=brs%20(Bow%20River%20Solutions)%20Logo.png)
 By
·
4 minute read
By
·
4 minute read
Building a paginated report is only part of the journey. Once the layout is finalized, the data is wired correctly, and the report is published, the real value begins. This is where governance, distribution, access, and user experience come into play.
This article explores what happens after a paginated report is published—how reports are configured, consumed, delivered, embedded, and ultimately evaluated as the right tool for a given business need. For organizations that rely on precision, consistency, and scalable reporting, these post-publication steps are where paginated reports truly prove their value.
Life after Publishing: What Changes in the Power BI Service
Paginated reports can be published directly from Power BI Report Builder to the Power BI Service. Once published, however, additional configuration is often required to ensure the report runs reliably and securely.
-
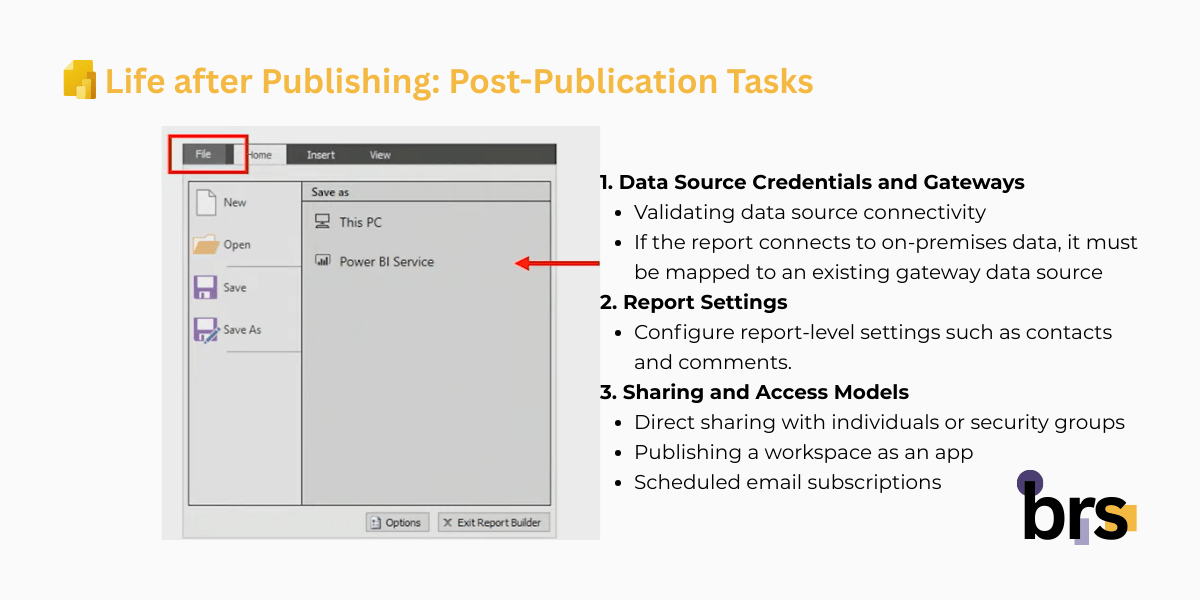
Data Source Credentials and Gateways
A common post-publication task involves validating data source connectivity. Some data sources—such as Azure SQL or on-premises systems—require credentials to be re-applied or mapped correctly in the Power BI service.
If the report connects to on-premises data, it must be mapped to an existing gateway data source. This step ensures the report can reach its underlying systems consistently and securely. If the gateway is already configured for interactive Power BI reports, the same gateway can typically be reused for paginated reports.
The key takeaway: publishing is not the end—it is the moment where operational readiness begins.
-
Report Settings: Comments, Contacts, and Governance
Once a report is live, authors can configure report-level settings such as contacts and comments.
Comments can be powerful in collaborative scenarios, such as shared performance reviews or operational discussions. However, they are not always appropriate. When reports use row-level security or personalized filters, users may see different slices of data. In those cases, shared comments can create confusion rather than clarity.
For highly filtered or role-specific reports, disabling comments is often the right governance choice.
-
Sharing and Access Models
How users access a paginated report is just as important as how it is built. Paginated reports can be shared in several ways:
- Direct sharing with individuals or security groups
- Publishing a workspace as an app
- Scheduled subscriptions that push reports to users by email
Each approach supports different operational needs. Direct sharing works well for small audiences. Apps provide structured, governed access at scale. Subscriptions enable proactive delivery without requiring users to sign in.
Consumption Experiences across Devices
Paginated reports are designed for consistency, but they are still accessible across multiple consumption channels.
-
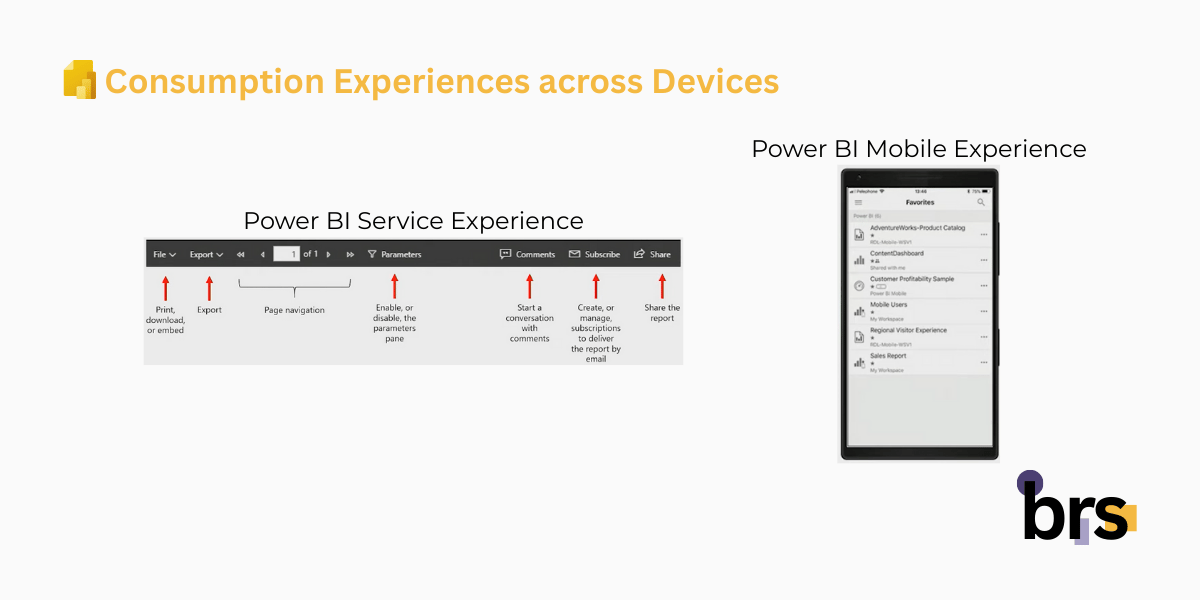
Power BI Service Experience
In the Power BI service, users can:
- Navigate pages
- Set parameters
- Export to supported formats (PDF, Excel, Word, PowerPoint)
- Print reports
- Create subscriptions
- Share or embed reports
The experience emphasizes execution and output rather than exploration.
-
Power BI Mobile Experience
In the Power BI mobile app, paginated reports are clearly identified with a distinct icon. While functionality is more limited than in the browser, users can still:
- Open reports
- Set parameters
- Navigate pages
- Change orientation
- Mark reports as favorites
It is important to note that paginated reports accessed through the mobile app must be hosted in the Power BI service—on-premises reports are not supported in this experience.
Delivery at Scale with Subscriptions
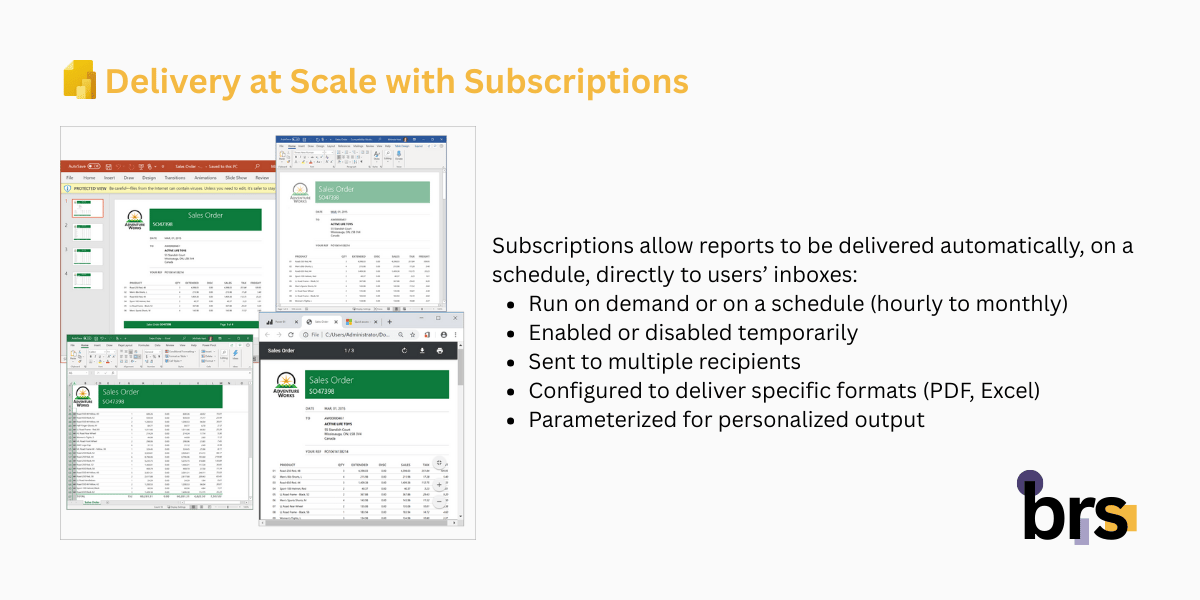
Subscriptions are one of the most powerful features of paginated reports.
They allow reports to be delivered automatically, on a schedule, directly to users’ inboxes—complete with attachments.
Subscription Capabilities
Subscriptions can be:
- Run on demand or on a schedule (hourly to monthly)
- Enabled or disabled temporarily
- Sent to multiple recipients
- Configured to deliver specific formats (PDF, Excel)
- Parameterized for personalized output
Authors can also define email subjects, messages, expiration dates, and include links back to the live report.
Working with Parameter Defaults
If a parameter uses an expression—such as “today’s date”—subscriptions will honor that expression as long as the parameter value is left untouched. Manually entering a value overrides the expression. This distinction is critical when designing reports intended for automated delivery.
Embedding Paginated Reports
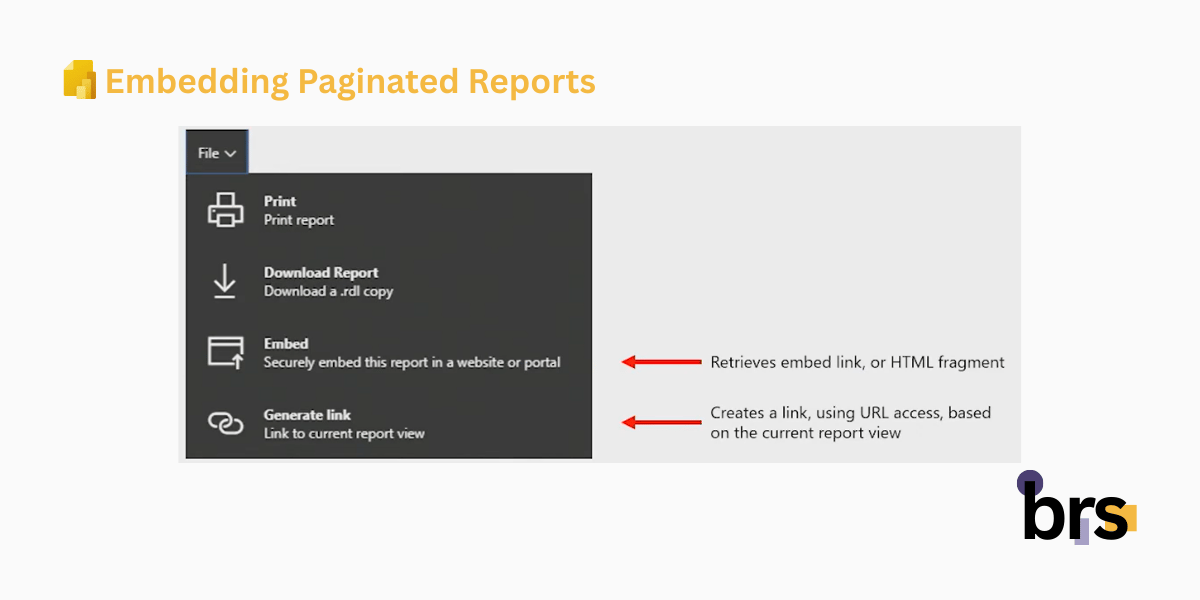
Beyond standard sharing and subscriptions, paginated reports can be embedded into other applications.
Secure Embedding vs. Generated Links
- Embed links are designed for secure embedding scenarios, such as internal applications or SharePoint pages.
- Generated links are ideal for URL-based access, especially when reports use multiple parameters. These links automatically include parameter syntax, making them easier to reuse and integrate.
This approach enables seamless drill-through scenarios—for example, navigating from an interactive Power BI report to a detailed, pixel-perfect paginated report.
URL Access: Precision Control through the Browser
Paginated reports support robust URL access. By manipulating the URL, you can:
- Set parameter values
- Hide or show the parameter pane
- Specify export formats
- Control rendering behavior using device-specific settings
This allows organizations to automate report generation, integrate reports into workflows, and deliver tailored outputs without rebuilding logic.
When Paginated Reports Are the Right Choice
The final—and most important—question is when paginated reports should be used.
Paginated reports are not a replacement for interactive Power BI reports. They serve a different purpose.
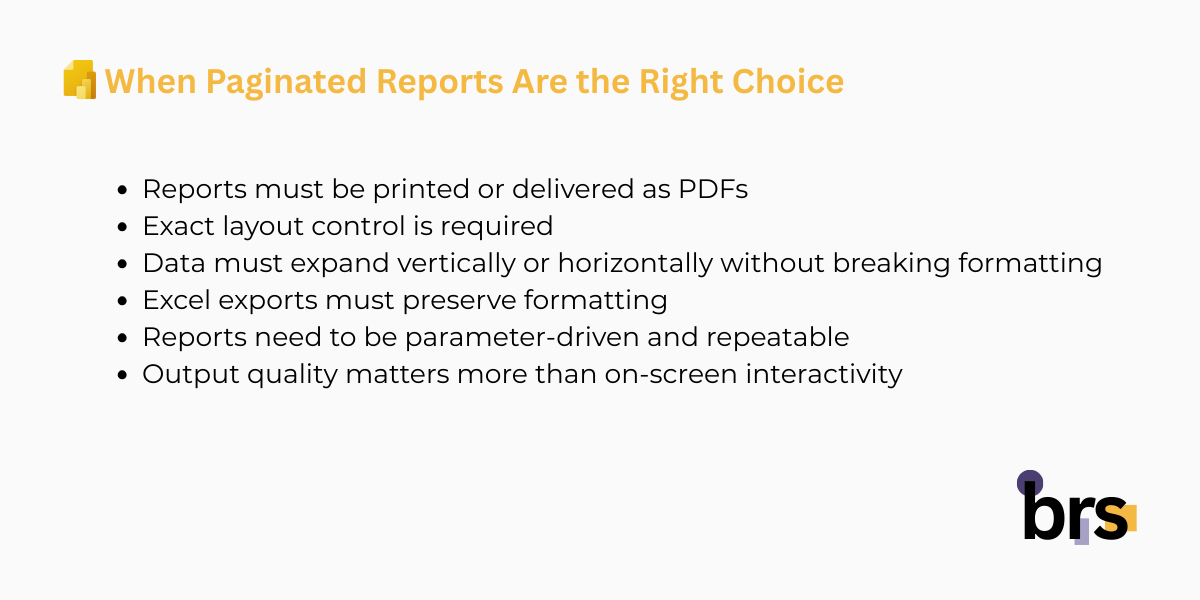
Paginated reports excel when:
- Reports must be printed or delivered as PDFs
- Exact layout control is required
- Data must expand vertically or horizontally without breaking formatting
- Excel exports must preserve formatting
- Reports need to be parameter-driven and repeatable
- Output quality matters more than on-screen interactivity
A common pattern is pairing interactive Power BI reports with paginated reports—using one for exploration and the other for formal output.
Why Paginated Reports Continue to Matter
Paginated reports offer a deep set of capabilities that remain unmatched scenarios:
- Print-ready, pixel-perfect layouts
- Multiple rendering formats with consistent quality
- Expression-driven layouts and conditional visibility
- Per-user formatting and logic
- Native query support
- Multiple data sources in a single report
- Advanced parameterization
- Image data sourced directly from databases
- Custom code and integration with modern services
- Flexible grid layouts using tablix
- Spatial data rendering
- Rich text and HTML formatting
- Interactive features such as drill-through and sorting
- Scheduled subscriptions with full attachments
These features make paginated reports indispensable for operational reporting at scale.
Conclusion
Power BI paginated reports are not about dashboards or discovery. They are about precision, consistency, and delivery.
When the goal is to distribute structured, formatted information—reliably and repeatedly—paginated reports remain the strongest option in the Power BI ecosystem. Used alongside interactive reports, they create a complete reporting strategy that supports both insight and execution.
The key is not choosing one over the other—but understanding where each delivers the most value.
At brs, we can help you turn your data into insights with Power BI. Whether you are in oil and gas, mining, or manufacturing, our team can design and implement interactive reports or paginated reports tailored to your needs.
Your data is your most valuable asset — let us help you visualize it. Contact us today at info@bowriversolutions.com or visit www.bowriversolutions.com to start your data visualization journey.
About This Series
This article is part of our Power BI Paginated Reports Series, a structured guide designed for both business leaders and report authors.
For C-level and senior decision-makers, the series explains how paginated reports support operational reporting, governance, scalability, and consistent decision-making across the organization. For analysts, developers, and power users, it provides practical insight into how paginated reports are designed, built, and refined using Power BI Report Builder.
Each article focuses on a specific stage of the paginated report lifecycle—from foundational concepts to advanced capabilities. You can explore the series in order or jump directly to related topics:
-
Previous article: Power BI Paginated Reports Series: Adding Interactive Features
-
View the full series: https://bowriversolutions.com/blog